













Financial reporting and analysis

Insights that enable better decisions

By bringing financial planning, reporting and analysis together in one platform, it becomes easier to understand actuals, follow performance over time, and act faster when conditions change.

Logo06
Logo01
HSB-planacy-customer-logo
kvdbil-planacy-customer-logo
Logo03
Logo04
foodora-planacy-customer-logo
sabis-logotyp-brun
Logo05
Ramudden-planacy-customer-logo
landskrona-stad-planacy-customer-logo
Logo06
Logo01
HSB-planacy-customer-logo
kvdbil-planacy-customer-logo
Logo03
Logo04
foodora-planacy-customer-logo
sabis-logotyp-brun
Logo05
Ramudden-planacy-customer-logo
landskrona-stad-planacy-customer-logo
Logo06
Logo01
HSB-planacy-customer-logo
kvdbil-planacy-customer-logo
Logo03
Logo04
foodora-planacy-customer-logo
sabis-logotyp-brun
Logo05
Ramudden-planacy-customer-logo
landskrona-stad-planacy-customer-logo

From numbers to insights

Reporting and analysis that create clarity across the organisation

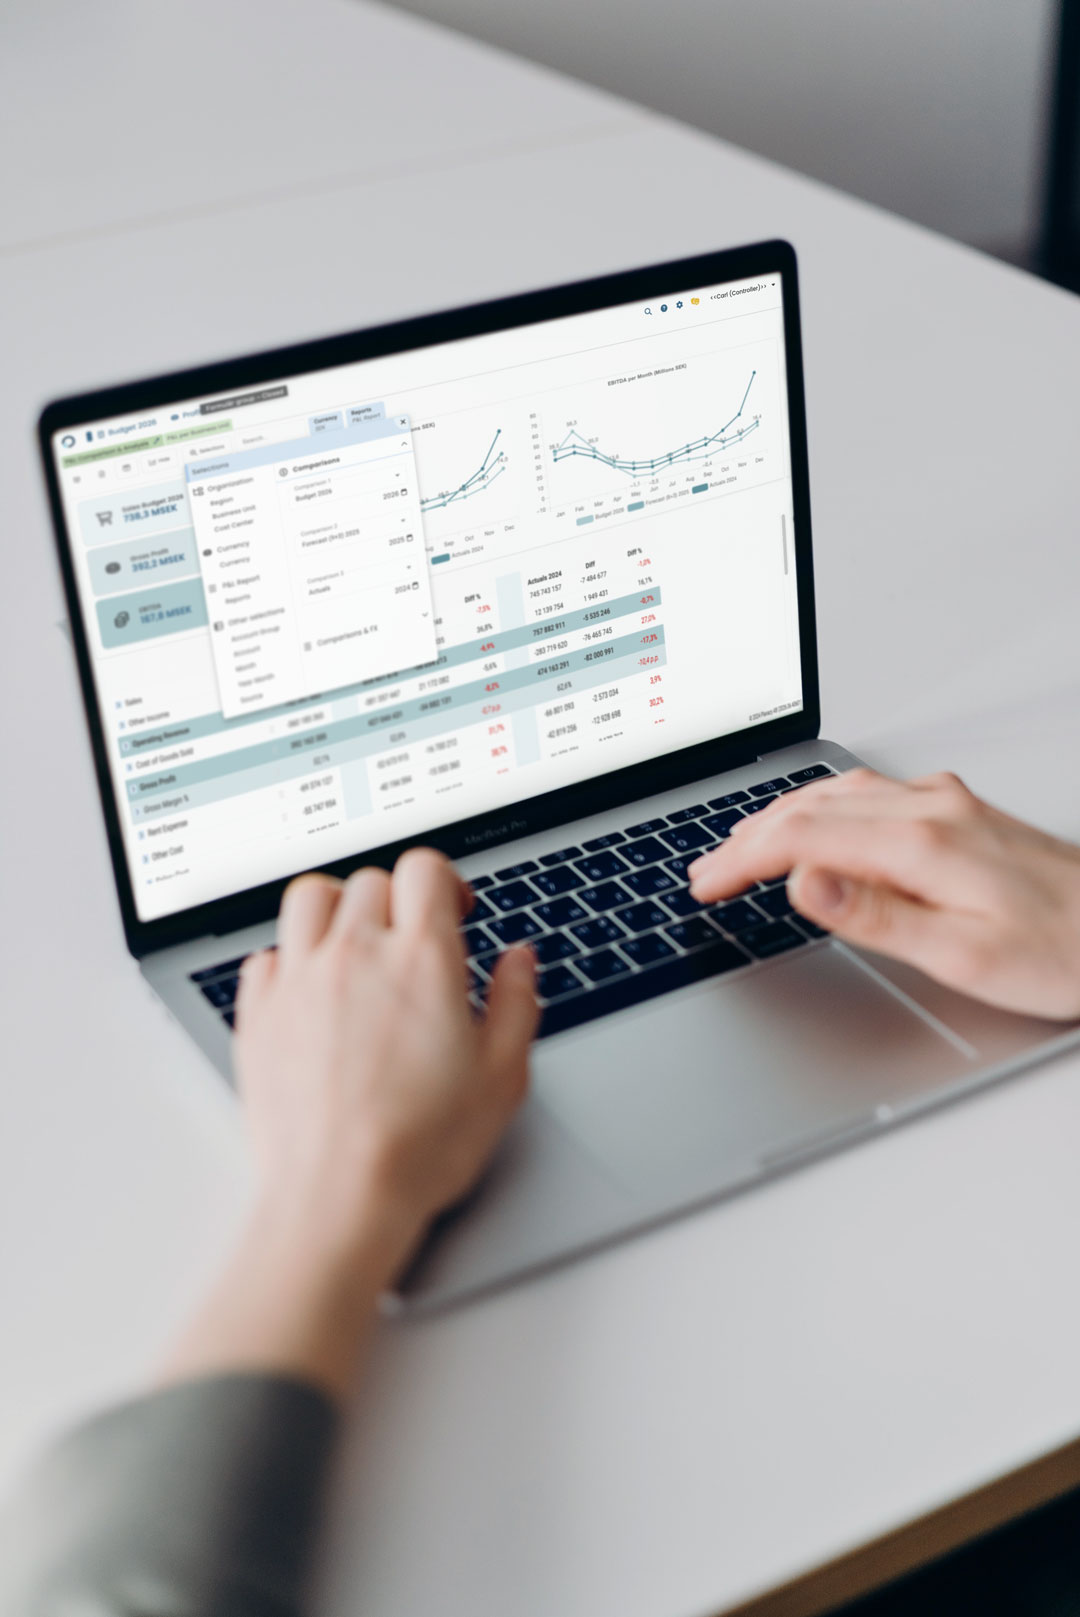
In Planacy, you can set up both clear dashboards and flexible reports that make it easy to visualise your most important KPIs and outcomes. This gives FP&A teams and decision-makers better conditions for analysing trends, identifying deviations, and comparing results against budget and forecast.

planacy-rapportering-analys-uppföljning

Tailor your reporting to your needs

Every organisation works differently, which is why your reporting needs to reflect your specific structures, dimensions and priorities. With Planacy, you get reports and dashboards that fit your processes and make it easy to follow up on what is most relevant to your organisation.

  • Flexible reports and dashboards based on your needs
  • Follow-up of KPIs, actuals, budget and forecast
  • Analyse data across multiple dimensions quickly and smoothly
  • Give different parts of the organisation access to relevant views and insights

Faster analysis and better decisions

Good reporting is not just about presenting numbers, but about making them useful. With clear visualisations and connected data, it becomes easier to see what is driving performance, identify deviations early, and create a better foundation for decision-making. This strengthens the analytical work of the FP&A team and makes it easier to turn financial data into concrete insights for the wider organisation.

  • Visualise trends, deviations and developments over time
  • Compare actuals against budget and forecast
  • Create a better basis for decision-making for both FP&A teams and management
planacy-finansiell-rapportering-uppföljning-analys
planacy-excel-google-sheets-add-in-integration

Integrations for further analysis

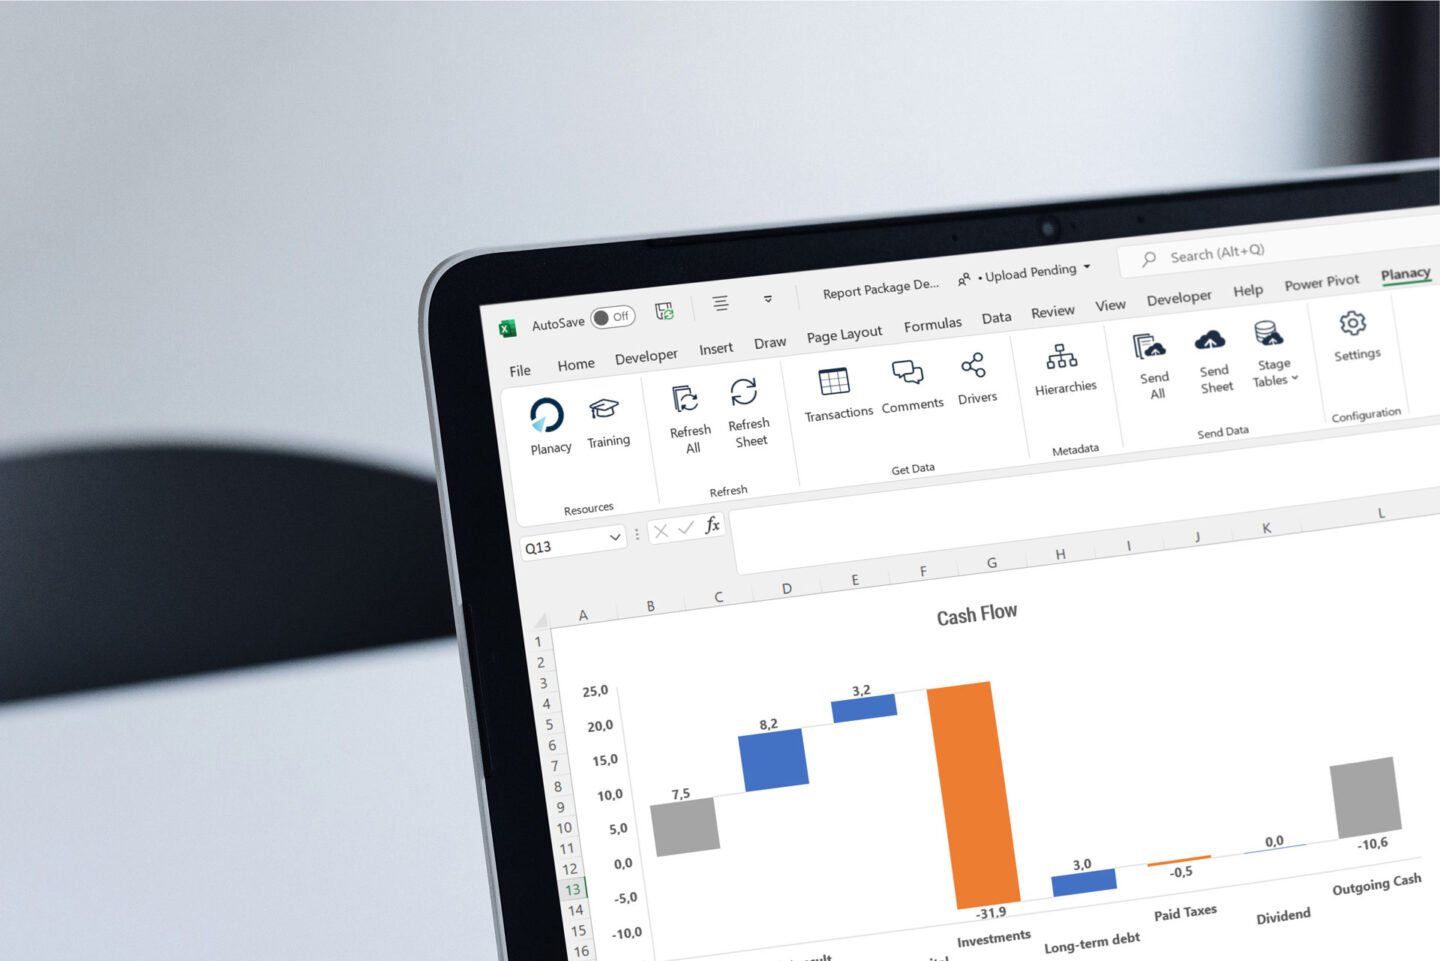
Planacy gives you full flexibility in how you work with and analyse your financial data. In addition to our own analysis and reporting features, we offer both a powerful Excel add-in and functionality for seamlessly integrating Planacy with the market’s leading business intelligence platforms, should you already have investments in these.

Try Planacy Reporting

Feel just how smooth modern financial planning can be

Explore Planacy in our interactive demo! Try it out for yourself and discover how intuitive and powerful our system really is. We have a limited number of examples, so book a demo for the full Planacy experience.

Customer Stories

Customised solutions for over 200 businesses from different industries

Ready to simplify your financial reporting and analysis?

With Planacy, you get a platform where reporting, analysis and financial planning are fully connected. This gives you a better overview, less manual work, and better conditions for making data-driven decisions quickly and smoothly.